
Big Data Analytics - K-Means Clustering
k-means clustering aims to partition n observations into k clusters in which each observation belongs to the cluster with the nearest mean, serving as a prototype of the cluster. This results in a partitioning of the data space into Voronoi cells.
Given a set of observations (x1, x2, …, xn), where each observation is a d-dimensional real vector, k-means clustering aims to partition the n observations into k groups G = {G1, G2, …, Gk} so as to minimize the within-cluster sum of squares (WCSS) defined as follows −
$$argmin \: \sum_{i = 1}^{k} \sum_{x \in S_{i}}\parallel x - \mu_{i}\parallel ^2$$
The later formula shows the objective function that is minimized in order to find the optimal prototypes in k-means clustering. The intuition of the formula is that we would like to find groups that are different with each other and each member of each group should be similar with the other members of each cluster.
The following example demonstrates how to run the k-means clustering algorithm in R.
library(ggplot2)
# Prepare Data
data = mtcars
# We need to scale the data to have zero mean and unit variance
data <- scale(data)
# Determine number of clusters
wss <- (nrow(data)-1)*sum(apply(data,2,var))
for (i in 2:dim(data)[2]) {
wss[i] <- sum(kmeans(data, centers = i)$withinss)
}
# Plot the clusters
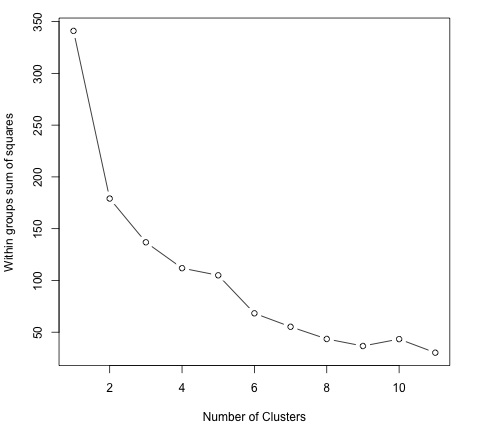
plot(1:dim(data)[2], wss, type = "b", xlab = "Number of Clusters",
ylab = "Within groups sum of squares")
In order to find a good value for K, we can plot the within groups sum of squares for different values of K. This metric normally decreases as more groups are added, we would like to find a point where the decrease in the within groups sum of squares starts decreasing slowly. In the plot, this value is best represented by K = 6.
Now that the value of K has been defined, it is needed to run the algorithm with that value.
# K-Means Cluster Analysis
fit <- kmeans(data, 5) # 5 cluster solution

# get cluster means
aggregate(data,by = list(fit$cluster),FUN = mean)

# append cluster assignment
data <- data.frame(data, fit$cluster)


