Tableau - Basic Filters
Filtering is the process of removing certain values or range of values from a result set. Tableau filtering feature allows both simple scenarios using field values as well as advanced calculation or context-based filters. In this chapter, you will learn about the basic filters available in Tableau.
There are three types of basic filters available in Tableau. They are as follows −
Filter Dimensions are the filters applied on the dimension fields.
Filter Measures are the filters applied on the measure fields.
Filter Dates are the filters applied on the date fields.
Filter Dimensions
These filters are applied on the dimension fields. Typical examples include filtering based on categories of text or numeric values with logical expressions greater than or less than conditions.
Example
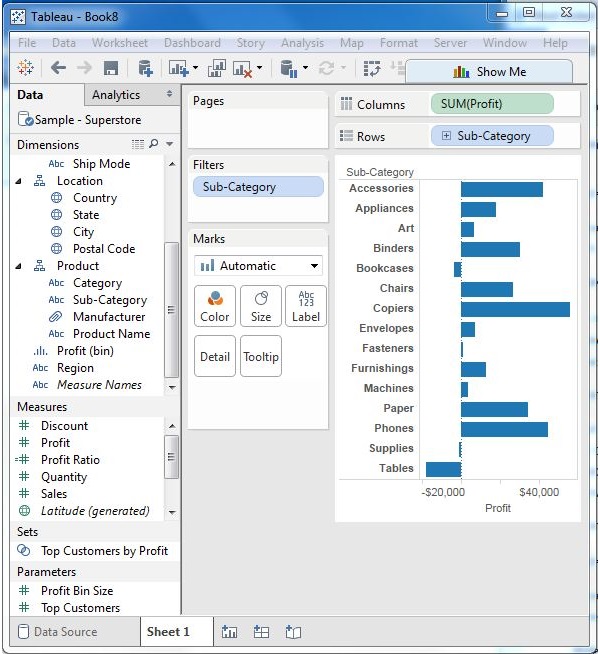
We use the Sample - Superstore data source to apply dimension filters on the sub-category of products. We create a view for showing profit for each sub-category of products according to their shipping mode. For it, drag the dimension field “Sub-Category” to the Rows shelf and the measure field “profit” to the Columns shelf.
Next, drag the Sub-Category dimension to the Filters shelf to open the Filter dialog box. Click the None button at the bottom of the list to deselect all segments. Then, select the Exclude option in the lower right corner of the dialog box. Finally, select Labels and Storage and then click OK. The following screenshot shows the result with the above two categories excluded.
Filter Measures
These filters are applied on the measure fields. Filtering is based on the calculations applied to the measure fields. Hence, while in dimension filters you use only values to filter, in measures filter you use calculations based on fields.
Example
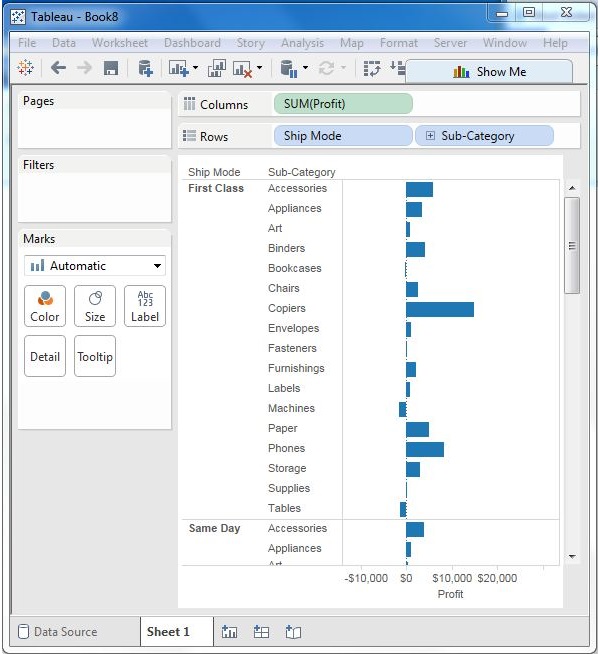
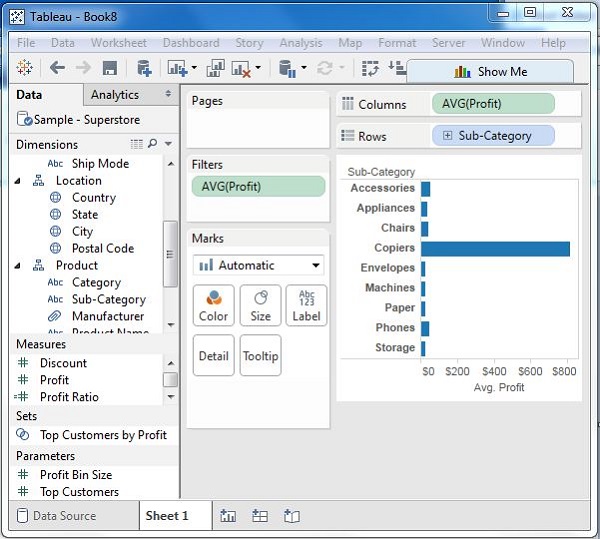
You can use the Sample - Superstore data source to apply dimension filters on the average value of the profits. First, create a view with ship mode and subcategory as dimensions and Average of profit as shown in the following screenshot.
Next, drag the AVG (profit) value to the filter pane. Choose Average as the filter mode. Next, choose "At least" and give a value to filter the rows, which meet these criteria.
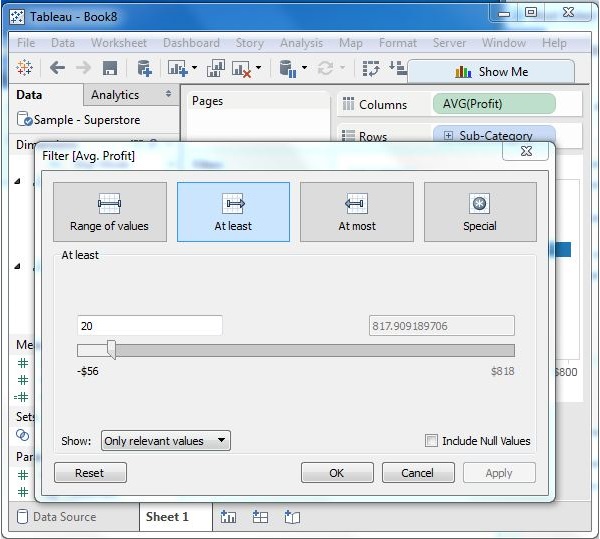
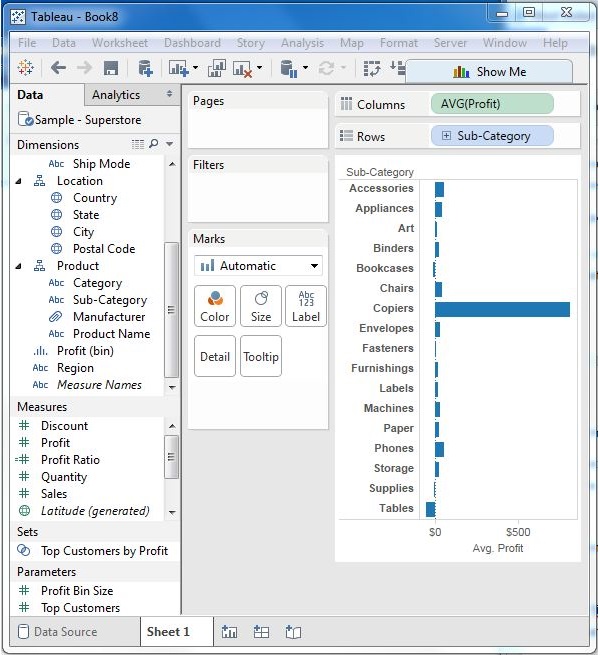
After completion of the above steps, we get the final view below showing only the subcategories whose average profit is greater than 20.
Filter Dates
Tableau treats the date field in three different ways while applying the date field. It can apply filter by taking a relative date as compared to today, an absolute date, or range of dates. Each of this option is presented when a date field is dragged out of the filter pane.
Example
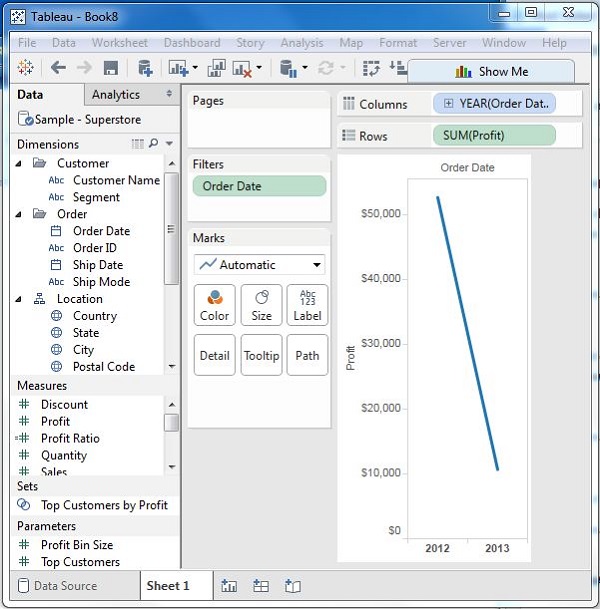
We choose the sample - Superstore data source and create a view with order date in the column shelf and profit in the rows shelf as shown in the following screenshot.
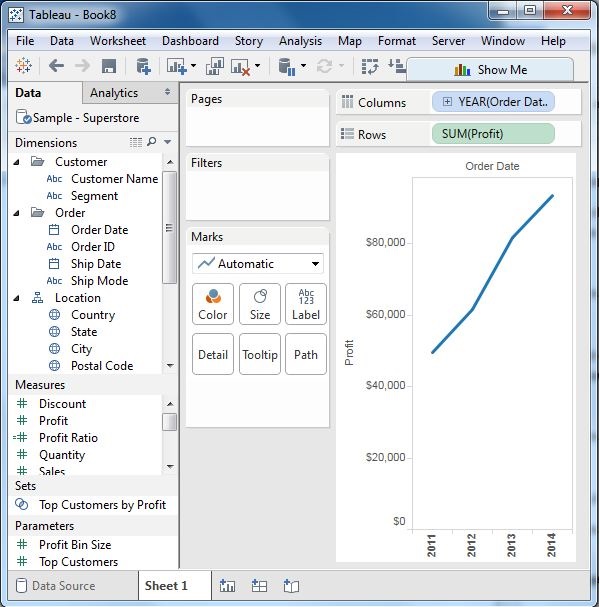
Next, drag the "order date" field to the filter shelf and choose Range of dates in the filter dialog box. Choose the dates as shown in the following screenshot.
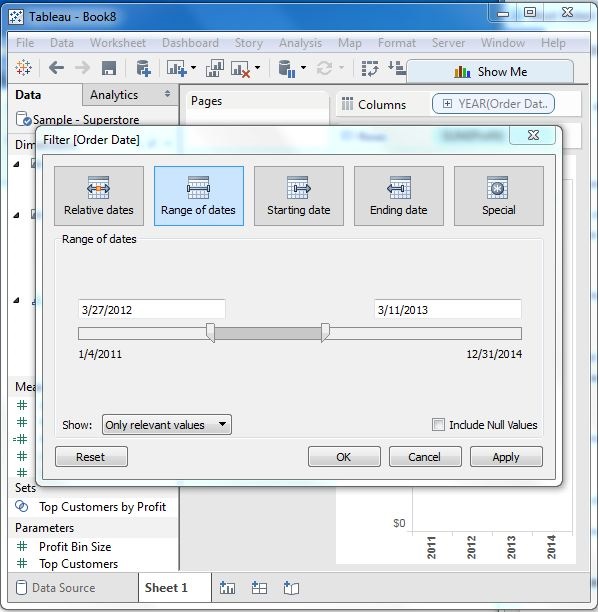
On clicking OK, the final view appears showing the result for the chosen range of dates as seen in the following screenshot.