
Key Performance Indicators
A Key Performance Indicator (KPI) is a quantifiable measurement for gauging business objectives. Examples of KPIs are −
Sales department of an organization use a KPI to measure monthly gross profit against projected gross profit.
Accounting department measure monthly expenditures against revenue to evaluate costs.
Human resources department measure quarterly employee turnover.
Business professionals frequently use KPIs that are grouped together in a business scorecard to obtain a quick and accurate historical summary of business success or to identify trends.
KPIs are a form of communication involving the following activities −
Identifying the KPIs based on the organization’s objectives.
Monitoring and reporting the KPIs.
Altering the KPIs as the organization progresses and / or the organization’s goals change.
The second and third objectives given above can be achieved with Power View. A KPI includes Base Value, Target Value/ Goal and Status.
Base Value
A Base Value is defined by a calculated field that resolves to a value. The calculated field represents the current value for the item in that row of the Table or Matrix. For example, aggregate of sales, profit for a given period, etc.
Target Value
A Target Value (or Goal) is defined by a calculated field that resolves to a value, or by an absolute value. The current value is evaluated against this value. This could be one of the following
A fixed number that is the goal all the rows should achieve. E.g. Sales target for all the salespersons.
A calculated field that might have a different goal for each row. For example, Budget (calculated field), department-wise in an organization.
Status
Status is the visual indicator of the value. In Power View, you can edit the KPI, choosing which indicators to use and what values to trigger each indicator.
Identifying the KPIs
The first and the most crucial step in KPI analysis is to identify the KPIs that effectively monitor the required trends in the organization. This requires complete understanding of the objectives and requires proper communication channels between the analysts and those who are responsible for fulfilling the objectives.
There are a number of KPIs to choose from, but the success in monitoring relies on the right choice of those that are relevant to the objectives. The KPIs differ from organization to organization and from department to department. It is effective only when they lead to improvement in the performance.
You can evaluate the relevance of a KPI using the SMART criteria, i.e. the KPI should be Specific, Measurable, Attainable, Relevant and Time-bound. In other words, the KPI chosen should meet the following criteria −
The KPI reflects your Specific objective.
The KPI enables you to Measure progress towards that goal.
The goal for which the KPI is being defined is realistically Attainable.
The goal that the KPI is targeting is Relevant to the organization.
You can set a Time-frame for achieving the goal so that the KPI reveals how near the goal is as compared to the time that is left.
The defined KPIs are to be evaluated from time to time to find their relevance as the time progresses. If required, different KPIs need to be defined and monitored. The KPIs might have to be edited as the time progresses. Only then, your KPI monitoring will be relating to the current organization needs.
Defining KPIs in the Data Model
Once you identify the KPIs, you can define them in the Data Model and add them to your Power View report to show the status of the set goals. You can do any of the following −
Define the KPIs in the Data Model and use them as fields in Power View to visualize them.
Define and / or edit the KPIs in Power View.
You will learn how to define KPIs in the Data Model in this section. The other method you will learn in the next section.
Suppose you want to monitor the sales targets of the salespersons in an organization who are selling a product. The objective is to identify the best performers who are meeting the Sales Target. You can proceed to define the KPI as follows −
Base Value − Current Value of the Sales Amount for each salesperson.
Target Value / Goal − Target Value is fixed for all the salespersons so as to enable comparison between the salespersons. Assume that the Sales Target is 3500.
Status − The Status is to be displayed with a graphic to easily determine the status of the Base Value compared to the Target Value.
Define the KPI in the Data Model as follows −
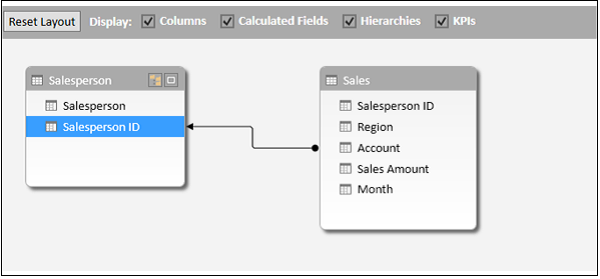
- Consider the two data tables - SalesPerson and Sales.
- Create a relationship between the two data tables using the field SalesPerson ID.
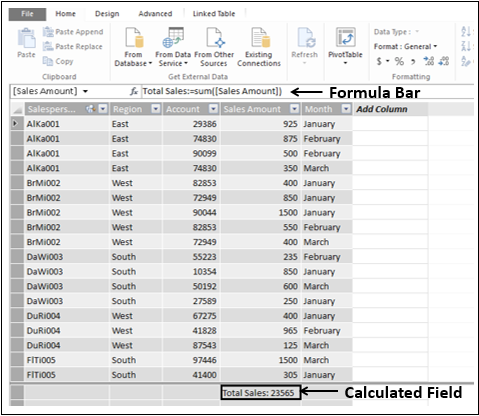
To set the Base Value, you need a calculated field for Sales Amount.
- Click the Data View in the Power Pivot window.
- Click in the cell at the bottom of the column Sales Amount
- Type the following DAX formula in the formula bar.
Total Sales:=SUM([Sales Amount])
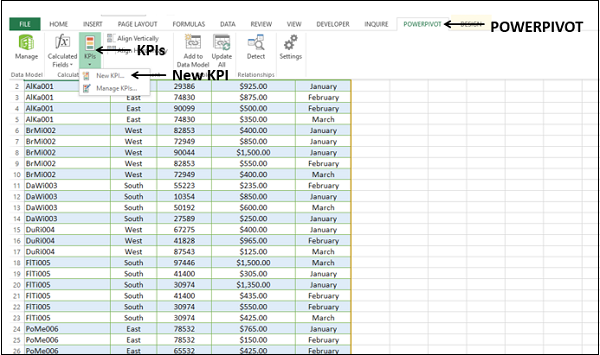
- Click in the Excel window.
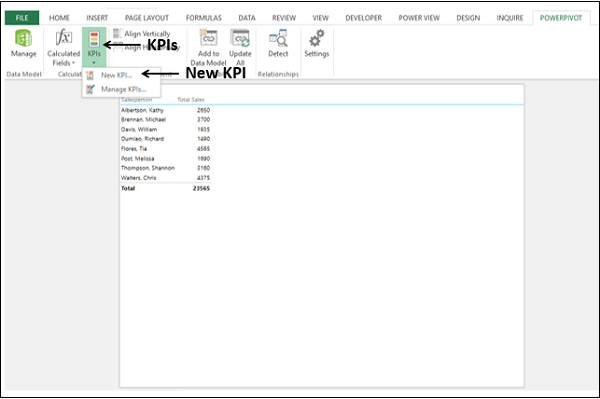
- Click the POWERPIVOT tab on the Ribbon.
- Click KPIs in the Calculations group.
- Select New KPI from the dropdown list.
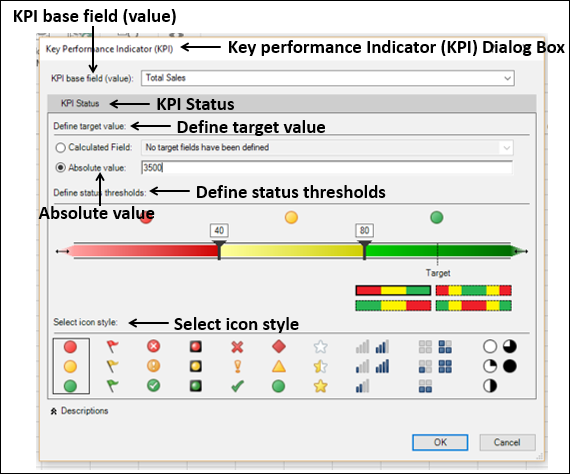
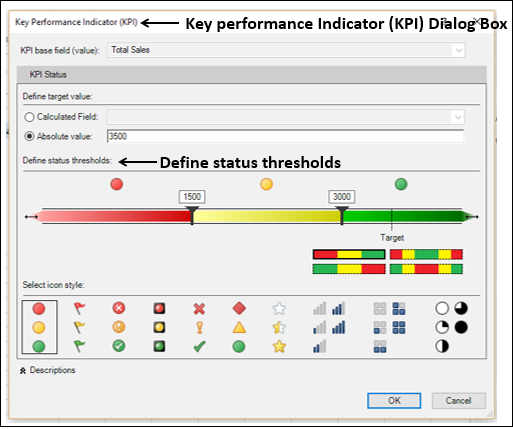
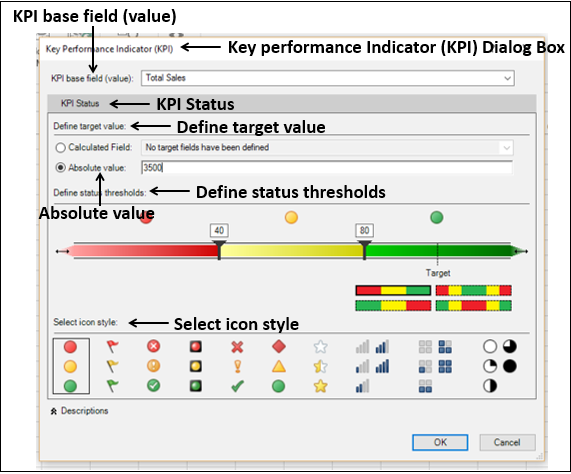
The Key Performance Indicator (KPI) dialog box appears.
Select Total Sales in the KPI base field (value) box.
Under KPI Status, do the following −
Under Define target value, select Absolute value and type 3500 in the box.
Under Define status thresholds, adjust the vertical bars representing the percentages to 40 and 80.
Under Select icon style, select the first option.
Click OK.
To check the KPI in the Data Model, do the following −
- Click in the Power Pivot window.
- Select the diagram view.
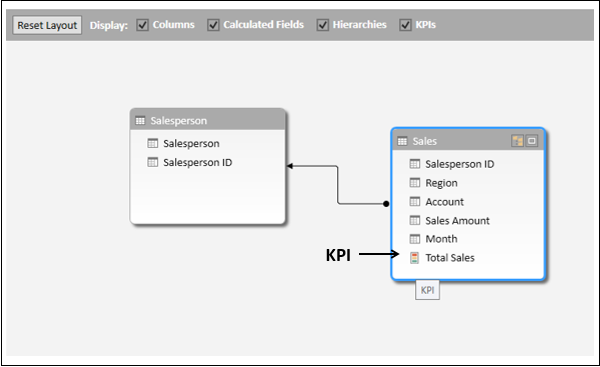
The Total Sales appears as a KPI field in the Sales data table.
Visualization of KPIs in Power View
Create a Power View sheet to visualize the KPI that you have defined.
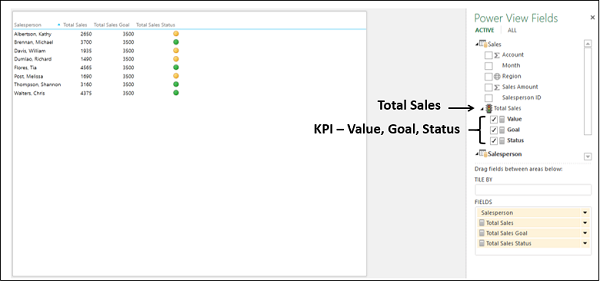
You will observe the following in the Sales table in Power View Fields list −
Total Sales field is a KPI and is depicted by the icon
 .
.The three KPI parameters – Value, Goal and Status appear as fields under Total Sales KPI.
Select the three fields – Value, Goal and Status under the KPI Total Sales from the Sales table.
Select the field Salesperson from the Salesperson table.
Table visualization appears by default.
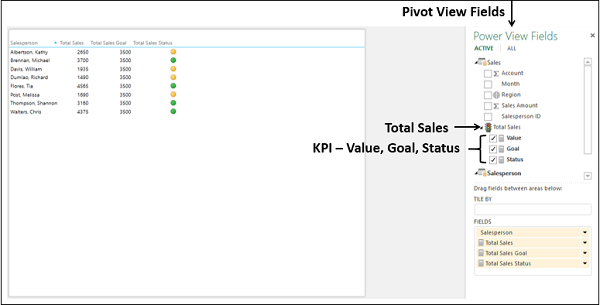
The three KPI parameters appear as columns in the Table, with the Status column displaying the icons as per the corresponding values.
Editing KPIs in Power View
You can also define the KPI thresholds by values instead of percentages. To modify the defined KPI Total Sales, proceed as follows −
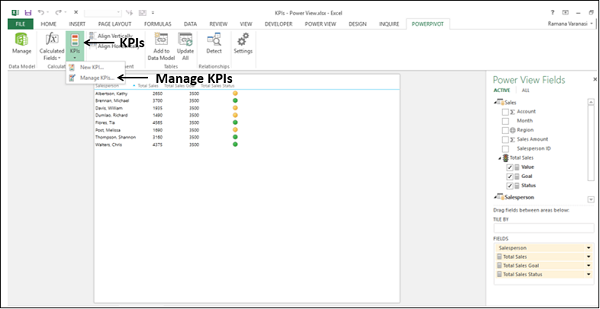
Click the POWERPIVOT tab on the Ribbon.
Click KPIs in the Calculations group on the Ribbon.
Select Manage KPIs from the dropdown list.
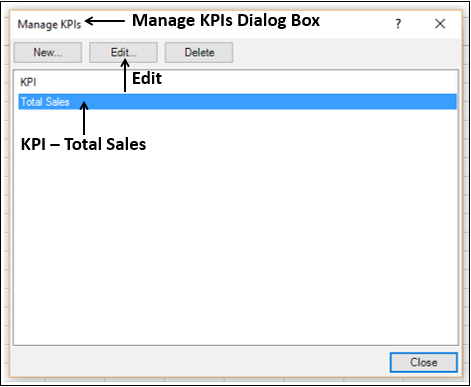
The Manage KPIs dialog box appears.
Click KPI – Total Sales.
Click the Edit button.
The Key Performance Indicator (KPI) dialog box appears.
- Under Define status thresholds, adjust the vertical bars to 1500 and 3000.
- Retain the rest of the earlier options and click OK.
Click Close in the Manage KPIs dialog box.
Power View displays a message that the Data Model is changed. Click OK.
You can see that the status icons reflect the changed thresholds
Defining KPIs in Power View
You can define a KPI from the Power View sheet itself. Suppose you do not have the calculated field Total Sales in the Data Model. You can create that from Power View itself.
Create a new Power View sheet.
Click the POWERPIVOT tab on the Ribbon.
Click Calculated Fields in the Calculations group on the Ribbon.
Select New Calculated Field from the dropdown list.
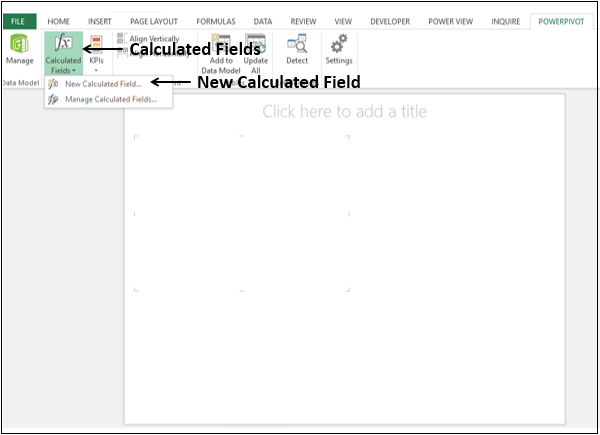
The Calculated Field dialog box appears.
Fill in the details for the calculated field as shown below and click OK.
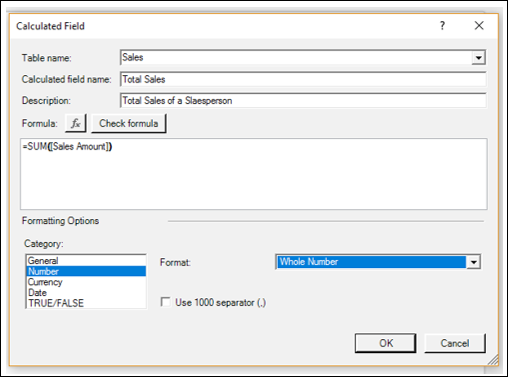
The calculated field Total Sales appears in the Sales table in the Power View Fields list.
You can identify it as a calculated field as it appears with a calculator ![]() icon.
icon.
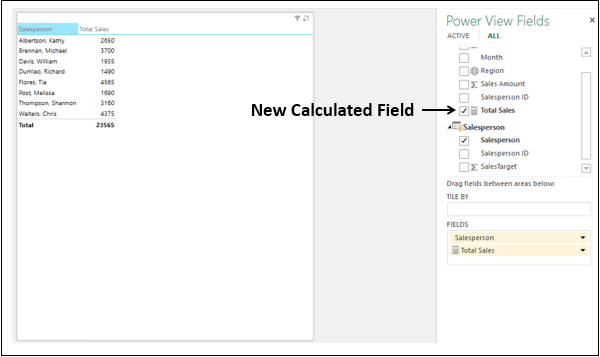
Now, you can use this calculated field to define a KPI from Power View.
- Click the POWERPIVOT tab on the Ribbon.
- Click KPIs in the Calculations group on the Ribbon.
- Select New KPI from the dropdown list.
The Key Performance Indicator (KPI) dialog box appears.
Select Total Sales in the KPI base field (value) box.
Under KPI Status, have the following options −
Under Define target value, select Absolute value and type 3500 in the box.
Under Define status thresholds, adjust the vertical bars representing the percentages to 40 and 80.
Under Select icon style, select the first option.
Click OK.
Total Sales appears as a KPI depicted by the icon ![]() with the three KPI parameters – Value, Goal and Status as fields under it.
with the three KPI parameters – Value, Goal and Status as fields under it.
Aesthetic Reports with KPIs in Power View
You can create an aesthetic report of Sales Performance with KPIs in Power View as follows −
Create a Table with the fields – Salesperson, Total Sales and Total Sales Status.
Click below the Table in Power View.
Create a Table with the fields – Salesperson, Total Sales and Total Sales Goal.
Switch visualization to 100% Stacked Bar Chart.
Click next to the Table in Power View.
Create a Table with the fields – Salesperson, Region, Total Sales and Total Sales Status.
Switch visualization to Card.
Drag the field Region to Tile By.
Type the Title – Sales Performance for the Power View Report.
Resize Table, 100% Stacked Bar Chart and Card for conspicuous visualization.
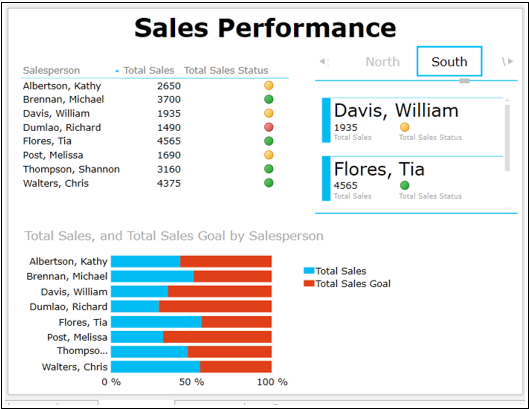
Observe that in Power View, you could portray the results as follows −
Table with icons for KPI status.
100% Stacked Bar Chart depicting the percentage achieved with respect to the Goal. You can also notice that it gives a clear comparison of the performance of all the Salespersons.
Card visualization depicting the KPI status of the Salespersons along with the Region, which they belong. You can interactively scroll through the Tiles to display results for different Regions that would give scope to assess performance regionwise also.


