Hellwach Lenard Potential Frequency Graph

Description:
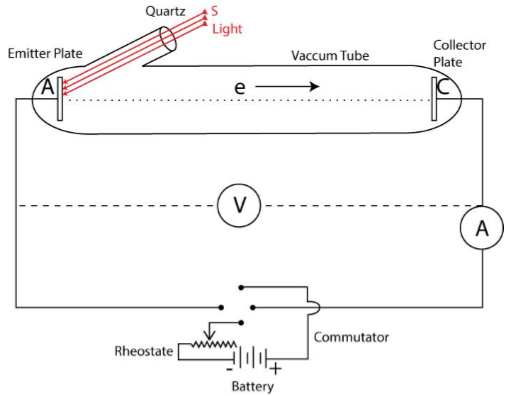
If the frequency of the light is kept constant and the experiment is repeated by using light of different intensities, it is observed that in all cases V0 remains the same.
Thus, for a given frequency of light, the stopping potential or cut-off voltage and the maximum kinetic energy of photo-electrons are independent of the intensity of light.
When the intensity of light is kept constant and the frequency of light is changed it is observed that stopping potential is different for different frequency of light.
It can also be observed that saturation current is same for different frequency of light.
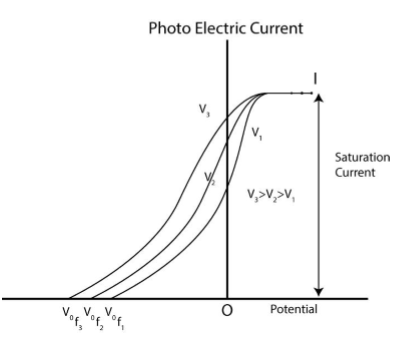
So, we can infer that −
The energy of emitted photo-electron depends on the frequency of light i.e. energy of electron increases with increase of frequency of light.
The stopping potential becomes more negative when the frequency of light is increased.
When the intensity of light is kept constant and the frequency of light is gradually increased from its minimum value. It is observed that no photo-electric current is recorded till a certain frequency v0 is reached.
Thus, the minimum frequency required to eject an electron from the metal is known as threshold frequency.
This frequency is dependent on the metal of emitter plat i.e. the threshold frequency is different for different metals of emitter.
The relationship between work function and threshold frequency is given by −
∅0 = hv0
Where,
∅0 = Work function.
𝒉 = Plank’s constant.
v0 = Threshold frequency.