Velocity Time Graphs

Description:
The Concept
Velocity – Time graphs display the motion of a particle by showing the changes of velocity with respect to time.
For Example,
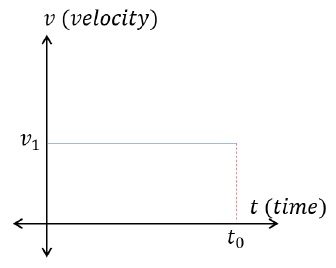
Above velocity – time graph represents an object moving with uniform velocity, v1, in positive direction.
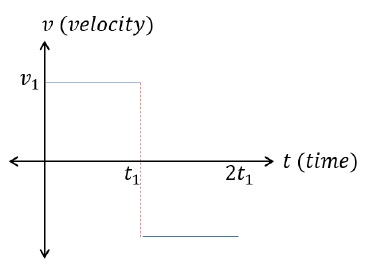
Above velocity – time graph represents particle going at uniform velocity in positive direction until, t = t1, when it changes direction and starts moving with uniform velocity, v1, in opposite direction.
Sailent Points
Velocity – Time graphs are also called v − t graphs.
Slope of Velocity – Time graph gives instantaneous acceleration.
Slope of any curve = dydx (Revisit Differential Calculus for more details)
Slope of Velocity - time graph = dxdt = inst.acceleration
Area under the Velocity – Time graph gives Displacement (or Change in Position).
Area under any curve = x2∫x1 f(x) . dx
Area under Velocity - time graph = t2∫t1 v . dt = displacement
Example Problem 1
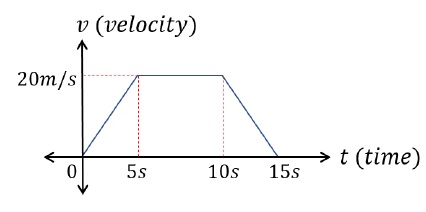
Calculate the acceleration of the object in each interval of time.
Solution
Velocity in the first 5s, a = dvdt = 20 - 05 - 0 m/s2 = 4 m/s2
Velocity in between 5s and 10s, v = dxdt = 20 - 2010 - 5 m/s2 = 0 m/s2
Velocity in between 10s and 15s, v = dxdt = 0 - 2015 - 10 m/s2 = -4 m/s2
Example Problem 2
Find the final position of the object if it started at x = 5m.
We know area under the curve of v − t graph gives displacement.
Area = 12 × 20 × 5 + 20 × 5 + 12 × 20 × 5 = 200 m
Therefore,
Final Position = Initial Position + Displacement
Final Position = 5 + 200 = 250 m
Note −
A line parallel to time axis indicates constant velocity motion.
Line parallel to velocity axis is not possible. It would indicate particle changing its velocity in no time.