SAS - Bar Charts
A bar chart represents data in rectangular bars with length of the bar proportional to the value of the variable. SAS uses the procedure PROC SGPLOT to create bar charts. We can draw both simple and stacked bars in the bar chart. In bar chart each of the bars can be given different colors.
Syntax
The basic syntax to create a bar-chart in SAS is −
PROC SGPLOT DATA = DATASET;
VBAR variables;
RUN;
Following is the description of parameters used −
DATASET − is the name of the dataset used.
variables − are the values used to plot the histogram.
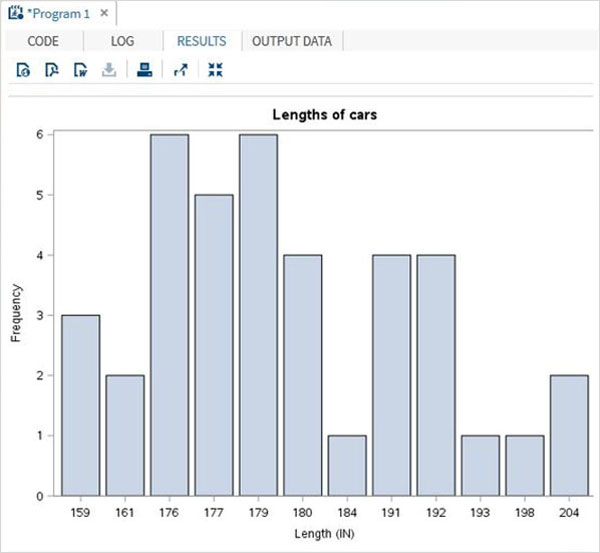
Simple Bar chart
A simple bar chart is a bar chart in which a variable from the dataset is represented as bars.
Example
The below script will create a bar-chart representing the length of cars as bars.
PROC SQL;
create table CARS1 as
SELECT make, model, type, invoice, horsepower, length, weight
   FROM
   SASHELP.CARS
   WHERE make in ('Audi','BMW')
;
RUN;

proc SGPLOT data = work.cars1;
vbar length ;
title 'Lengths of cars';
run;
quit;
When we execute the above code, we get the following output −
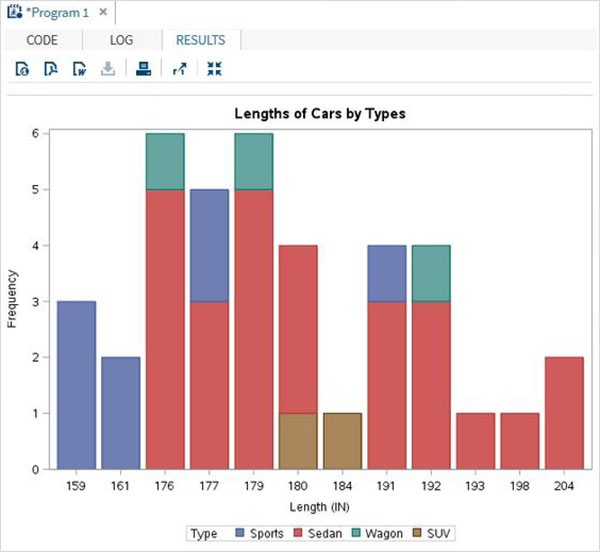
Stacked Bar chart
A stacked bar chart is a bar chart in which a variable from the dataset is calculated with respect to another variable.
Example
The below script will create a stacked bar-chart where the length of the cars are calculated for each car type. We use the group option to specify the second variable.
proc SGPLOT data = work.cars1;
vbar length /group = type ;
title 'Lengths of Cars by Types';
run;
quit;
When we execute the above code, we get the following output −
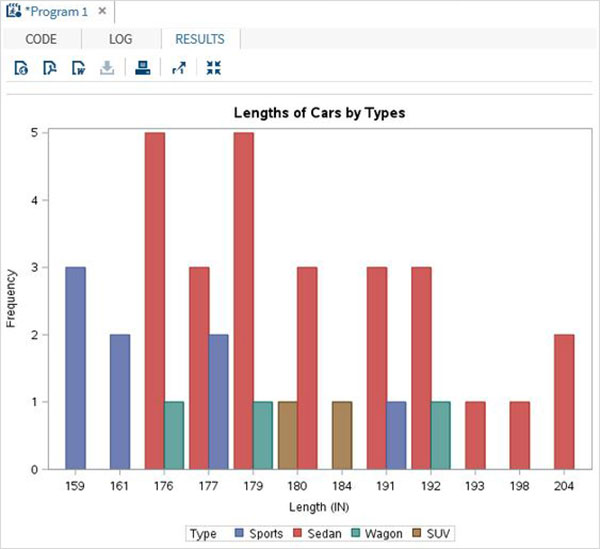
Clustered Bar chart
The clustered bar chart is created to show how the values of a variable are spread across a culture.
Example
The below script will create a clustered bar-chart where the length of the cars is clustered around the car type.So we see two adjacent bars at length 191, one for the car type 'Sedan' and another for the car type 'Wagon'.
proc SGPLOT data = work.cars1;
vbar length /group = type GROUPDISPLAY = CLUSTER;
title 'Cluster of Cars by Types';
run;
quit;
When we execute the above code, we get the following output −