SAS - Frequency Distributions
A frequency distribution is a table showing the frequency of the data points in a data set. Each entry in the table contains the frequency or count of the occurrences of values within a particular group or interval, and in this way, the table summarizes the distribution of values in the sample.
SAS provides a procedure called PROC FREQ to calculate the frequency distribution of data points in a data set.
Syntax
The basic syntax for calculating frequency distribution in SAS is −
PROC FREQ DATA = Dataset ;
TABLES Variable_1 ;
BY Variable_2 ;
Following is the description of the parameters used −
Dataset is the name of the dataset.
Variables_1 is the variable names of the dataset whose frequency distribution needs to be calculated.
Variables_2 is the variables which categorised the frequency distribution result.
Single Variable Frequency Distribution
We can determine the frequency distribution of a single variable by using PROC FREQ. In this case the result will show the frequency of each value of the variable. The result also shows the percentage distribution, cumulative frequency and cumulative percentage.
Example
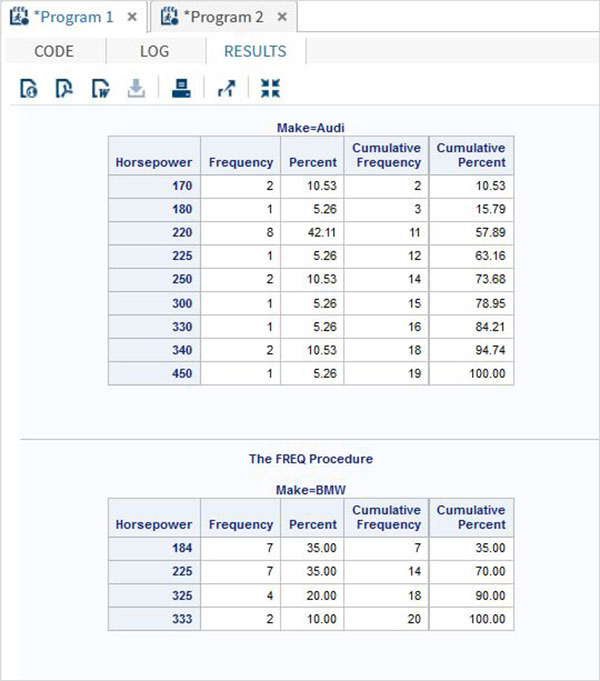
In the below example we find the frequency distribution of the variable horsepower for the dataset named CARS1 which is created form the library SASHELP.CARS. We can see the result divided into two categories of results. One for each make of the car.
PROC SQL;
create table CARS1 as
SELECT make, model, type, invoice, horsepower, length, weight
   FROM
   SASHELP.CARS
   WHERE make in ('Audi','BMW')
;
RUN;

proc FREQ data = CARS1 ;
tables horsepower;
by make;
run;
When the above code is executed, we get the following result −
Multiple Variable Frequency Distribution
We can find the frequency distributions for multiple variables which groups them into all possible combinations.
Example
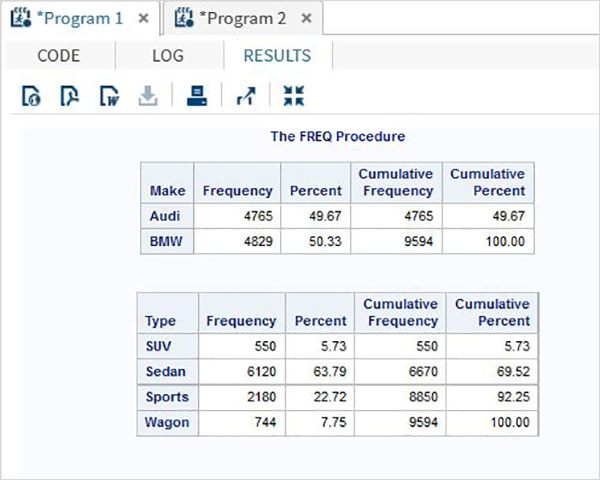
In the below example we calculate the frequency distribution for the make of a car for grouped by car type and also the frequency distribution of each type of car grouped by each make.
proc FREQ data = CARS1 ;
tables make type;
run;
When the above code is executed, we get the following result −
Frequency Distribution with Weight
With the weight option we can calculate the frequency distribution biased with the weight of the variable. Here the value of the variable is taken as the number of observations instead of the count of value.
Example
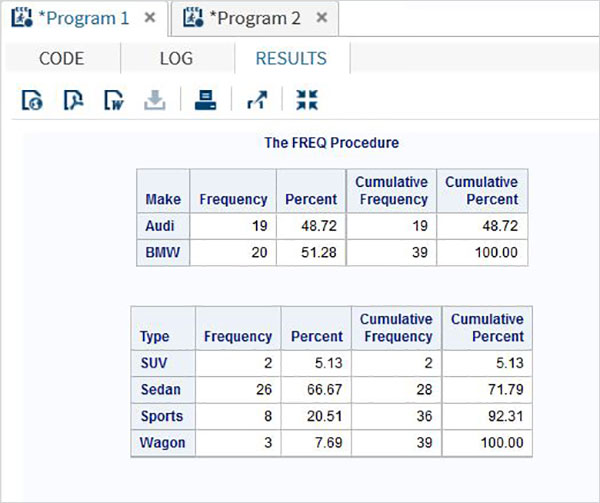
In the below example we calculate the frequency distribution of the variables make and type with weight assigned to horsepower.
proc FREQ data = CARS1 ;
tables make type;
weight horsepower;
run;
When the above code is executed, we get the following result −