E-R Graph for Charged Shell of Conducting Sphere

Description:
We know that electric field keeps on changing as we move from centre to infinity in case of a spherical shell or a metallic sphere. To study the relation between Electric field and the distance graphically, we take help of 3 derived relations −
Outside the shell E = E = 14πε0 qr2
Inside the shell E = 0
On the surface of the shell E = 14πε0 qR2
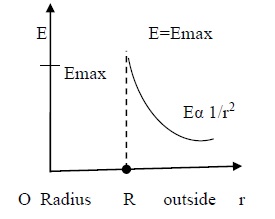
In graph X axis represents the distance (r) from the centre of the shell and Y axis represents electric field (E).
Point ‘O’ is the origin and represents the centre of the charged shell.
In X axis, we take a point ‘R’ such that the distance OR represents the radial distance of the shell.
Right side of point R, represents the outer surface of the shell.
Electric field in Y axis can go upto a certain maximum value.
We know that, inside the shell, electric field is always zero (from eq 2). So the straight line from O to R, on the X axis represents zero electric field.
On the surface of the shell, when distance = R , the electric field is maximum ( from eq 3). Represented by a dotted line from R to Emax.
As we move outside the shell, the electric field goes on decreasing with the increase in distance (r) (from eq1, E ∝ 1/r2). Represented by a falling exponential curve.